Protein Quantification with the NanoPhotometer® Pearl – Protein UV280 and Colorimetric Based Assays
Dr. Alexis Hofherr, Dr. Andrea Huber
Renal Division, Department of Medicine, University Medical Centre Freiburg, Implen GmbH, Munich
May 2011
NanoPhotometer-Pearl-Protein-Application-Note
Introduction
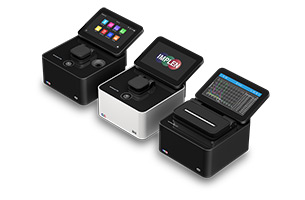
 Proteins, the dynamic parts of living cells, are involved in nearly all metabolic pathways of cells (e.g.: enzymatic reactions, immune protection and cellular response). The measurement of protein concentration is a frequently used method in life science research. Although there are many assays available, due care should be taken to select the optimum assay for the particular sample type. The decision on which assay to use is typically based on convenience, quantity and purity of protein available, presence of interfering agents, and the accuracy required. In this application note we describe the performance of the NanoPhotometer ® Pearl (Figure 1) in terms of linearity and accuracy, applying cuvetteless small volume protein quantification at 280 nm (Protein UV280) as well as colorimetric cuvette based assays.
Small volume protein determination at 280 nm (UV280) – Protein samples display a characteristic absorption spectrum at 280 nm (Noble, J. E. et al. 2009), predominantly from the aromatic amino acids phenylalanine, tyrosine and tryptophan. Therefore, the Lambert-Beer law can be applied to determine the protein concentration in a sample. However, this UV based approach depends strongly on the purity and primary sequence of a protein. Some substances which are commonly present in protein samples (e.g. nucleic acids or detergents like Triton-X) show strong UV absorbance, which should be corrected for or avoided altogether. For proteins with an unknown Lambert-Beer molar absorption coefficient this UV based method is an estimation. In summary, while being one of the most accurate methods of protein quantification due care has to be taken in sample preparation and measurements.
Cuvette Based colorimetric Assays – These methods are based on the formation of a complex between a specific dye and proteins in solution. Colorimetric assays are more suited for protein mixtures (e.g. lysates) and require an appropriate protein standard.
The Bradford assay (Bradford, M. M. et al., 1976) is probably the most commonly used method. It is based on quantifying the metachromatic shift of Coomassie Brilliant Blue G-250 from 465 to 595 nm. This shift is due to the stabilization of the anionic form of the dye upon protein binding. The majority of the observed signal is dependent on the interaction with arginine residues. Therefore, although fast, convenient and compatible with reducing agents, the Bradford assay suffers from characteristic protein to protein variations and interference from detergents.
The BCA assay (Smith, P. K. et al. 1985) is an enhancement of the classic Lowry method (Lowry, O. H. et al. 1951). It is based on the reaction of proteins and alkaline Cu2+. The residues that contribute to the reduction of Cu2+ include the cysteine, tryptophan, tyrosine, and the peptide bonds. Bicinchoninic acid (BCA) and cuprous ions (Cu+) form an intense purple complex, giving an absorbance maximum at 562 nm. The BCA assay is less sensitive to the presence of detergents and there is less protein to protein variation compared with the Bradford assay. However, the chemical reaction is temperature dependent with different functional groups displaying altered reactivity at elevated temperatures (Wiechelman, K. J. et al., 1988). Other known interferences are reducing agents or copper chelators.
Technical specifications of the NanoPhotometer® Pearl
 optical path of the NanoPhotometer® Pearl enables both cuvetteless measurement of protein samples (Figure 2, Figure 3) and standard cuvette measurements.
The cuvetteless small volume option allows reliable protein measurements (Riepl, M. et. al 2011) in a minimum sample volume starting at 0.3 μl. The sample is squeezed to exactly defined pathlengths and due to this Sample Compression Technology™ is independent from surface tension. This is important for accurate protein measurements. There are five different virtual dilutions lids available 1/5, 1/10, 1/50, 1/100 and 1/250. These different dilution lids guarantee for an exact pathlength over the lifetime of the instrument. Therefore, the NanoPhotometer® Pearl is recalibration and maintenance free. In addition, the Sample Compression Technology™ avoids evaporation, allows the sample to be easily be retrieved and, allows for reliable quantification of proteins dissolved in volatile solvents like toluene.
The available spectral scan range of the NanoPhotometer® Pearl is 200 nm to 950 nm, and the wavelength range for single and multiple wavelength measurements is between 190 nm and 1,100 nm. The average dynamic range for undiluted dsDNA is between 2 ng/μl and 18,750 ng/μl and  for bovine serum albumin is between 0.08 mg/ml and 543 mg/ml for the small volume option.
Experimental specifications
The performance of a protein quantification method in terms of accuracy, linearity and dynamic range has to be evaluated faithfully prior to integration in the daily laboratory routine. To guarantee accurate results, assay handling and measurement handling have to be optimized. Day stability and long term stability of the selected method have to be monitored as well.
Linearity and dynamic range
In this application note the linearity and the dynamic range of different protein quantification methods were verified with the NanoPhotometer® Pearl utilizing BSA in different concentrations. With each concentration, multiple independent measurements were carried out. After each measurement, the measurement window and the mirror in the lid were cleaned with a slightly wet fluff-free tissue (Figure 2) or the cuvette was changed, and a new aliquot of the sample was pipetted. To obtain accurate measurements it is essential to mix the samples very well before each measurement to guarantee homogeneity of the sample.
 The linearity via the Protein UV280 method was quantified in triplicates without prior dilution of the sample using lid 10 and lid 50 of the NanoPhotometer® Pearl. The sample volume was set to 1.5 μl and 1.0 μl, respectively. The resulting BSA concentrations were compared to measurements of the identical samples manually diluted 1/10 and 1/50 with standard quartz cuvettes (sample volume: 100 μl). The resulting linearity curve shows a close correlation between lid measurements and cuvette measurements over a broad dynamic range (2.0 – 107 mg/ml) with coefficient of determination (R2), of 0.9992 for lid 10 and 0.9982 for lid 50. In addition these data show that the lids can be changed, according to their specifications, without any influence to the measurement results (Figure 4 A).
The dynamic range measurements for the BCA and Bradford assays were performed with the Pierce® BCA Protein Assay Kit (Thermo Fisher Scientific, Germany) and the Bradford Reagent from Sigma (Sigma-Aldrich, Germany). Each sample was measured in duplicate according to the manufacturer instructions. For the BCA assay the absorbance of eight different BSA amounts were quantified at a 562 nm, and for the Bradford assay four different BSA amounts were measured at 595 nm. For both assays the photometric quantification was carried out in 1 ml standard plastics cuvettes with the NanoPhotometer® Pearl. Both assays show convincing correlations over their entire working range with coefficients of determination (R2) of 0.9989 (BCA) and 0.9992 (Bradford). Flattening of the curve at higher BSA concentrations is characteristic for the Bradford as well as for the BCA assay.
Accuracy
As shown previously, the NanoPhotometer® Pearl features an excellent accuracy regarding low volume protein quantification (Riepl, M. et al., 2011). In this application note the accuracy of the NanoPhotometer® Pearl was demonstrated with repeated measurements of a pure protein sample (BSA), as well as with complex protein samples isolated during coimmunoprecipitation.
 The Protein UV280 method was carried out with five different pure BSA amounts. Six independent quantifications were performed for each BSA sample without prior dilution with lid 10 and lid 50 or manually diluted 1/10 and 1/50 with quartz cuvettes (reference). The sample volume was set to 1.5 μl and 1.0 μl for lid 10 and lid 50 and to 100 μl for the cuvette measurements. The homogeneity of the samples was assured by mixing each sample very well before each measurement.
The resulting data show a very close relation between cuvetteless small volume and manually diluted standard volume measurements in cuvettes. In addition, the virtual dilution of the sample with lid 10 or with lid 50 shows almost identical measurement results. The indicated standard deviation of the six independent measurements is marginal (Figure 5) and the coefficients of variation (c.v.) for the repeated lid measurements ranged at a very low level between 0.7 % and 1.7 %.
The accuracy for the BCA and Bradford methods was analyzed with three different amounts of complex protein samples according to the manufacturer’s instruction. Each sample was measured independently six-fold with the NanoPhotometer® Pearl in standard plastic cuvettes (volume 1 ml). The BCA analysis was carried out with the polycystin 2 protein (PC-2), isolated from the canine kidney cell line MDCK by coimmunoprecipitation. The Bradford analysis was carried out with the CD2-associated protein (CD2AP), a scaffolding molecule of the actin cytoskeleton. According to the accuracy results for the Protein UV280 method the standard deviation for the repeated measurements is minimal and emphasizes the high accuracy of the whole application. The coefficients of variation (c.v.) are again very low and ranged between 0.5 % and 3.9 %.
 Day and long term stability
In final experiments, the day and the long term stability of Protein UV280 measurements were determined. For both time frames the instrument was blanked with buffer prior to a new measurement, a new aliquot of the BSA sample was pipetted onto the measurement window and the probe was quantified at 280 nm (lid 10, volume 1.5 μl). The day stability was carried out over a period of eight hours, the long term stability over a period of four days. In between the measurements the protein sample was stored at 4°C. The results show a minimal fluctuation of the sample concentration (Figure 6). The coefficients of variation (c.v.) were 1.7 % (day stability) and 1.3 % (long term stability), which are comparable to the c.v. values of the back-to-back measured accuracy results as shown in figure 5.
Besides this dual purpose design the NanoPhotometer ® Pearl, from Implen, accounts for simple sample handling as well as high throughput rates due to very short measuring times. Due to the Sample Compression Technology™ the NanoPhotometer® Pearl is recalibration free; this helps to reduce cost and down time, and provides accurate measurements over the life-time of the instrument.
Conclusion
Independent from the applied protein quantification method the NanoPhotometer® Pearl provides accurate, precise and highly reproducible measurement results over a broad dynamic range. This application note shows that different protein samples in the range of 2 -107 mg/ml, measured as triplicates either with lid 10 or lid 50, result in a linearity curve with a coefficient of determination (R2) of 0,9992 for lid 10 and 0,9982 for lid 50. Also, the standard deviation of six independent Protein UV280 measurements was shown as marginal, with a coefficient of variation (c.v.) between 0.7 % and 1.7 %.
The NanoVolume option of the NanoPhotometer® Pearl is therefore suited for laboratories where sample volumes are limited, a fast answer without prior dilution is needed, and where retrieval of the sample for subsequent applications is required.
Complex protein samples analyzed with the appropriate colorimetric quantification method should be quantified with the cuvette option of the NanoPhotometer ® Pearl. Here the Bradford and BCA assays used show convincing correlations over their entire working range, with coefficients of determination (R2) of 0.9992 (Bradford) and 0.9989 (BCA). The accuracy of different amounts of complex protein samples was shown in six-fold independent measurements with coefficients of variation (c.v.) between0.5 % and 3.9 %. The day and long term stability of protein samples also show minimal fluctuation of sample concentration, with coefficients of variation (c.v.) of 1.7% (day stability) and 1.3 % (long term stability).
Besides this dual purpose design the NanoPhotometer ® Pearl, from Implen, accounts for simple sample handling as well as high throughput rates due to very short measuring times. Due to the Sample Compression Technology™ the NanoPhotometer® Pearl is recalibration free; this helps to reduce cost and down time, and provides accurate measurements over the life-time of the instrument.
Literature
Noble, J. E. and Bailey J. A., Quantitation of Protein, Methods in Enzymology, (2009) Volume 463
Bradford, M. M., A rapid and sensitive method for the quantitation of microgram quantities of protein utilizing the principle of protein-dye binding, Anal. Biochem., (1976) 72: 248-254
Smith, P. K. et al., Measurement of protein using bicinchoninic acid, Anal. Biochem., (1985) 150:76-85 Lowry, O. H. et al., Protein measurement with the Folin phenol reagent, J. Biol. Chem., (1951) 193:265–275
Wiechelman, K. J. et al., Investigation of the bicinchoninic acid protein assay: Identification of the groups responsible for color formation, Anal. Biochem., (1988) 175:231–237.
Acknowledgment
The support of the Renal Division of the Department of Medicine, University Medical Centre Freiburg in this study is greatly appreciated.
NanoPhotometer® Pearl and Sample Compression Technology™ are trademarks of Implen GmbH and Implen, Inc.
Contact
Dr. Helena Funk
Implen GmbH
Schatzbogen 52
81829 München
Germany
Phone: +49 89 7263718 0
Fax: +49 89 7263718 54