The NanoPhotometer® – A synonym for spectrophotometric quantification of submicroliter and standard sample volumes with high reproducibility and linearity over a broad range
NanoPhotometer® Application Notes
Reena Kartha PhD, Fabienne Trotier, Dr. Andrea Kreuz, Dr. Andrea Huber
Department of Pathology, Stanford University, Institut für Medizinische Genetik, Charité Universitätsmedizin Berlin, Implen GmbH.
Introduction
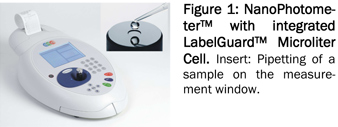
The spectrophotometrical analysis of nucleic acids, proteins and bacterial cell cultures is part of the daily routine in every modern laboratory. The universal NanoPhotometer® from Implen combines measurements of submicroliter sample volumes (starting with 0.7 ìl) and standard sample volumes. The submicroliter measurements are performed cuvetteless with the integrated LabelGuard™ Microliter Cell (Figure 1 and Figure 2). Higher volumes are measured with commercially available cuvettes.
 Due to its approach the NanoPhotometer® is an allrounder for the various spectrophotometrical applications in a modern laboratory. Based on the available methods for single/multiple wavelength and concentration measurements, full spectrum scans, standard curve determinations as well as ratio calculations and even kinetics, the user can create all kinds of customized applications for their individual needs. Predefined methods and functions are available for nucleic acid analysis (dsDNA, ssDNA, RNA, oligos), determination of the labeling efficiency (dye incorporation rate e.g. for microarray applications), protein quantification (Bradford, Lowry, BCA, Biuret, Protein A280 (according to Christian-Warburg)) and cell density measurements (OD 600)
In addition to a built-in printer option the NanoPhotometer® can be linked to a computer network via USB or Bluetooth connection for data export and printing options. Due to its versatility and the possibility to measure submicroliter sample volumes the NanoPhotometer® is a very useful analysis tool for technologies like Real-Time PCR, Laser Capture Microdissection and Microarray based applications.
Technical specifications
The available spectral scan range of the NanoPhotometer® is 200 nm to 950 nm, the wavelength range for single and multiple wavelength measurements is between 190 nm and 1,100 nm. The average dynamic range for undiluted dsDNA is between 15 ng/μl and 4,000 ng/μl (optional extensions for 7 ng/μl to 8,000 ng/μl are available), for proteins it is between 0.2 mg/ml and 100 mg/ml (e.g. BSA solution, also extendable).
Experimental specifications
High reproducibility and linearity over a broad concentration range are basic requirements for a reliable spectrophotometrical sample analysis. In this application note we describe the performance of the Nano- Photometer™ in terms of reproducibility and linearity for nucleic acid and protein samples as well as for cell density measurements of bacterial cultures.
Figure 2: Optical path of the NanoPhotometer®
Due to the integrated beam deflexion and the use of fiber-optic light conductors the sample can be measured directly on the measurement window. Using one of the four available lids of the microliter cell (lid 10, lid 50 and optional lid 5 or lid 100) different liquid columns of defined pathlength are created (Table 1). Virtual dilutions of up to 1/100 are generated in comparison to a standard 1 cm cuvette measurement, without a manual dilution of the sample. Dilution errors are avoided and the sample can be retrieved after the measurement.
 The linearity for different samples was verified utilizing an ATP solution, plasmid DNA, genomic DNA, an Escherichia coli culture and an immunoglobulin G (IgG) solution representing proteins. This specific setup of samples has been chosen to demonstrate the multiple applications which can be covered with the NanoPhotometer®. Every sample was serially diluted and independent multiple measurements of the optical density were carried out. After each measurement, the measurement window was cleaned with a dry Kimwipe (Figure 3) or the cuvette was changed and a new aliquot of the sample was pipetted. For nucleic acid and protein quantification the “Background Correction- Function” was turned on. To quantify ATP solution (100 mM), seven different dilution steps were generated. Ten independent measurements were taken from each dilution with lid 50 at 260 nm. The sample volume was set to 2 μl. The resulting data shows a very good linearity with a coefficient of determination of R2=0.9997 (Figure 4A). According to the Lambert-Beer law (e=E/c*d) an ATP extinction coefficient of 15.3 x 10³ M-1 cm-1 can be calculated based on this data. This value corresponds with the known ATP extinction coefficient of 15.4 x 10³ M-1 cm-1 determined in 1965 by Bock et al..
Figure 4: Linearity
An ATP solution, plasmid DNA, genomic DNA, E. coli culture and immunoglobulin G (IgG) solution were quantified to determine the linear range of the NanoPhotometer®. A) Seven dilution steps of an ATP solution were measured cuvetteless (lid 50) at 260 nm. Each dilution was measured 10 times. B) Triplicates of the plasmid DNA were measured at 14 dilution steps at 260 nm. The measurements were carried out cuvetteless. According to their dynamic range the corresponding lids were chosen. C) and D) The concentration of the genomic DNA was determined in 13 dilutions with lid 10 and lid 50 at 260 nm. Each dilution was measured in triplicates. E) The E. coli culture was measured in 14 dilution steps, each 8 times at 580 nm with 1 ml semi-micro plastic cuvettes. F) The concentration of the IgG solution was determined cuvetteless in 5 dilution steps at 280 nm (lid 10 and lid 50). Five independent measurements were performed with each dilution.
 Plasmid DNA (5,100 bp) was measured over a very broad concentration range starting from 5 ng/ìl up to 8,500 ng/ìl at 260 nm. 14 dilutions were quantified and each dilution was measured in triplicates with the corresponding lid of the Microliter Cell (Table 1). An overlapping dynamic range was measured with the equivalent lids. The calculated coefficients of determination (R2) for all lids were approximately 1 (Table 2). In addition, it could be proved that the measured concentrations, where overlapping, were independent of the lid. Moreover, even over this challenging concentration range, a linear correlation exists (Figure 4B). To quantify genomic DNA, 13 dilutions were measured in triplicates with lid 10 and lid 50 at 260 nm. The concentration range was selected between 30 ng/ìl and 700 ng/ìl. The sample volume was 3 ìl for both lids. Genomic DNA is difficult to measure because of the higher viscosity of the sample and the tendency to stick to surfaces. This validates the slightly lower coefficients of determination observed with these samples using both lids (R2=0.9807). Despite these obstacles, we were able to demonstrate a very good linear correlation with this sample (Figure 4C and 4D). The linearity measurements for bacterial cultures were performed with an E. coli culture. 14 dilutions were set up and each dilution was measured eight times at 580 nm with semi-micro plastic cuvettes (volume 1 ml). The resulting coefficient of determination (R2) was 0.9972 and confirms the high linearity of the photometer (Figure 4E). Similar experiments performed with Rhodobacter capsulatus were also consistent with these results (data available upon request from the authors).
To demonstrate the linearity with a protein sample, an IgG dilution series was selected. Five dilutions were set up and each dilution was measured cuvetteless 5 times at 280 nm (lid 10, lid 50). The sample volume was 3.5 ìl. The excellent coefficients of determination (R2) were 0.9998 and 0.9994 (Figure 4F). Besides, in a separate experimental set up it was also shown that the NanoPhotometer® is capable for higher protein concentrations because the function of the measurement window is independent of surface tension (data available upon request from the authors).
 The excellent reproducibility of the NanoPhotometer® could be demonstrated with repeated measurements of plasmid DNA, genomic DNA, E. coli suspension and IgG solution. The coefficients of variation (c.v.) for the plasmid DNA ranged at a very low level between 0.5 % and 2.8 % (Table 3). However, the coefficients of variation values for genomic DNA varied at a higher range between 3.6 % and 4.0 % using lids 10 and 50 respectively (Table 4). Considering the fact that the measurement of genomic DNA is difficult due to the nature of the samples, the observed coefficients of variation are in an excellent range. Besides, these values were obtained without any prior heating or pretreatment of samples.
The 14 dilution steps of the E. coli culture were measured 8 times each. The standard deviations of the 8 independent measurements are minimal and emphasize the high reproducibility of the photometer (Figure 5A, error bars).
Analyzing the IgG solution confirms a minimal standard deviation of the single measurements from the mean for all measurements (Figure 5B, error bars). In addition the difference between the reference concentration and the measured concentration is also very small.
An additional important application built into the NanoPhotometer® is the quantitative and qualitative analysis of fluorescent dye labelled samples. In addition to the common cyanine dyes (Cy3, Cy3.5, Cy5 and Cy5.5), different AlexaFluorophore, Oyster-Dyes and Texas Red can be measured.
To analyze the performance for the determination of the incorporation rate for Cy3 and Cy5, 10 aliquots of genomic DNA were labelled using the Agilent labelling protocol for Array CGH. The samples were measured at the corresponding wavelengths (Figure 6). Table 5 shows the quantity and quality of the DNA used for the experiment as well as the dye concentration and incorporation rate.
During the experiment the time per measurement for the NanoPhotometer® was also monitored. The average total handling time per sample was determined to be 20 seconds including a measurement time of less than 4 seconds.
Conclusion
The NanoPhotometer® from Implen counts for high accuracy, robustness and absolutely reliable and precise results for submicroliter and cuvette measurements. Simple sample handling for very low and standard volumes (0.7 to 3,500 μl) as well as high throughput rates due to very short measuring times are the major advantages of the system. The Nano- Photometer™ offers an unmatched dynamic range and a very high reproducibility of measurements. With its maintenance free setup, the NanoPhotometer® helps to reduce cost and down times.
The NanoPhotometer® will serve as a powerful tool in every genomic or proteomic laboratory engaged in nucleic acid and protein based research, microarray analysis as well as for the analysis of bacterial cell cultures.
Literature
Bock et al., (1956), Arch. Biochem. Biophys. 62: 253– 264
Acknowledgment
The ATP dilution series data were kindly provided by Ulrich F. Müller PhD, Department of Chemistry and Biochemistry, University of California San Diego. The IgG data were kindly provided by Dr. Alfons Nichtl, Penzberg.
Contact
Implen GmbH
Am Schatzbogen 52
81829 Munich
Germany
Dr. Andrea Kreuz
Dr. Andrea Huber
Email: [email protected]
Phone: +49-89-7263718 0
Implen Inc.
Suite 521-23
5655 Lindero Canyon Road
Westlake Village, CA 91362 USA
Dr. Thomas Sahiri
Email: [email protected]
Phone: +1-818-706 3500